Free Die With Zero spreadsheet alternatives
Yes — free Die With Zero spreadsheets and calculators exist, and a few are genuinely useful. Here's what's actually out there, what each is for, and where a static sheet runs out of road.
The free options people share
Spend Curve and Time Buckets, from the book's own publisher, are the most authoritative free tools. Spend Curve takes your age, retirement age, life expectancy, net worth and expected return, and draws the save-then-spend curve the book describes — it doesn't store what you enter. Time Buckets takes the experiences you want to have and sorts them into 5–10-year windows of your life, matching the book's chapter on front-loading experiences while your health can carry them. Both are single- purpose: one draws a curve, the other organises a wish list. Neither solves for a number or tests your plan against a bad decade of markets.
A shared Google Sheets Die With Zero template is one of the more commonly linked DIY versions — make your own copy, drop in your numbers, and it projects a balance forward. The Money After Graduation Die With Zero Plan spreadsheet does the same job: it projects your investment balance year by year toward a target end date, so you can see roughly when a straight-line drawdown gets you to zero. Money Flamingo's free FI-tools page includes a Die With Zero / drawdown calculator built to test a few withdrawal strategies against your own return and life-expectancy assumptions. There's also a shared Medium calculator built around the book's survival-threshold idea, set up so anyone can use it without requesting edit access.
All of these are free, and all of them are worth trying before you build anything more complicated. If you just want a rough sense of the shape of a die-with-zero drawdown, any one of them will show it to you in a few minutes.
What a spreadsheet is good at
A spreadsheet is the right tool when you want a quick, transparent, one-off answer: plug in a return rate and a life expectancy, watch a balance decline to a target date, done. You can see every formula, which matters if you don't trust a black box. For a first look at the die-with-zero method — does the shape of the idea even make sense for your numbers — a free sheet is genuinely enough.
Where it stops being enough
A spreadsheet answers "what happens if returns average X% and I live to Y" — one path, picked in advance. Three things it can't easily do:
- Keep a safety floor that scales with your situation. Zeroing out a balance on schedule is easy to model; keeping back enough at every point along the way to survive a bad stretch is a different, harder calculation, and most sheets don't attempt it.
- Test more than one market path. A single average-return row tells you nothing about the plans that fail because a downturn lands early. Sequence-of-returns risk means the order returns arrive in matters as much as the average — something only a simulation across many possible paths can show you, not a fixed-rate projection.
- Solve for the number, rather than test one you guessed. Most sheets ask you to pick a spending figure and see if it works out. Finding the largest figure that still lands near zero — the die-with-zero number — means solving for it, not guessing and checking by hand.
None of that makes a free spreadsheet bad. It makes it a sketch: useful for direction, not for a number you'd actually plan around.
What zeroleft adds
zeroleft is a free planner built to do the parts a spreadsheet struggles with:
- Solves for your die-with-zero number directly, rather than making you guess a figure and check it.
- Keeps a survival-threshold floor back automatically, so the number isn't reckless by construction.
- Runs a Monte Carlo stress test across thousands of market paths, so you see the real odds a plan survives a bad sequence of returns — not just what a flat average predicts. How different drawdown approaches compare is covered here.
- Plans gifts and experiences against the same numbers, instead of a separate wish list.
It has no tax model, same as every tool on this list, and it's an independent tool — not affiliated with or endorsed by Bill Perkins or the publisher. If you're already wondering whether you're saving too much, running the actual number is the difference between a feeling and an answer.
zeroleft's own sample plan makes this concrete rather than asserted, because the spreadsheet number and the solved number aren't actually different — building the same maths in a sheet gets you close to the same £34,275 a year zeroleft's own straight-line solve produces. That was never the gap.
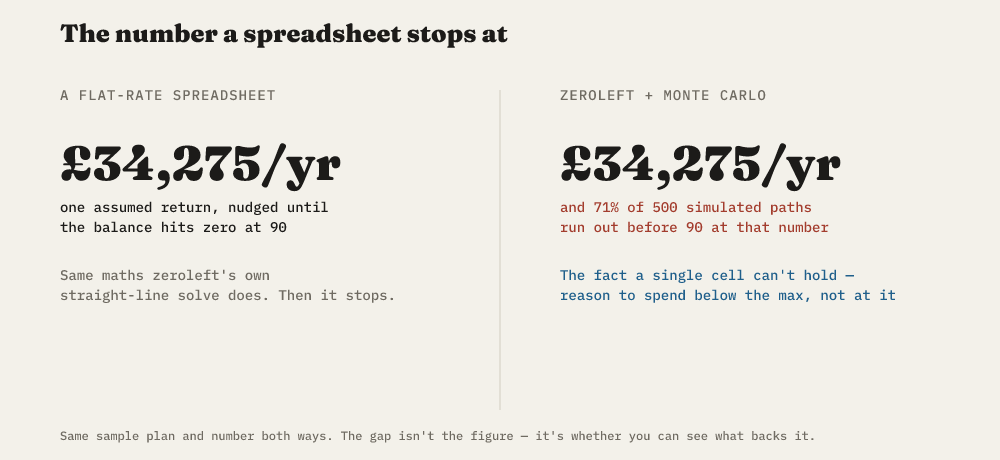
The gap is what happens next. A spreadsheet gives you £34,275 a year and stops — one assumed return, nudged until the balance lands at zero. Run the same plan through zeroleft's Monte Carlo and the figure doesn't move, but a second fact appears next to it: 71% of 500 simulated market paths run out of money before 90 at that exact number, because it's the outer edge of what the plan can sustain, not a cushioned estimate. A spreadsheet has no cell for "how many of the paths I didn't run would have failed."
Start with whichever gets you moving
If you want a five-minute feel for the idea, try Spend Curve or one of the shared sheets above — there's no reason to skip the free, quick option. If you're past that and want the actual number, with a floor kept back and a stress test behind it, that's what zeroleft solves for.
zeroleft is a planning aid, not financial advice, and has no tax model. It's an independent tool, not affiliated with or endorsed by Bill Perkins or the publisher.
Common questions
Is there a free Die With Zero spreadsheet?
Yes — several. The book's own publisher offers two free apps (Spend Curve and Time Buckets), and independent creators have shared Google Sheets versions. None of them run a market stress test; they show one projected path.
Can I do Die With Zero in a spreadsheet?
For a single straight-line projection, yes. A spreadsheet struggles once you want a safety floor that adjusts with your numbers, or the odds of the plan surviving a bad decade of returns — that needs a model re-run across many market paths, not one row of assumptions.
What's the difference between the official Die With Zero apps and zeroleft?
The official apps (Spend Curve, Time Buckets) are companion tools from the book's publisher and carry the book's own branding. zeroleft is an independent, unaffiliated planner built around a solver, a survival-threshold floor and a Monte Carlo stress test — closer to a full plan than a single curve or a list of experiences.
zeroleft turns this into a plan you can act on — free, and the numbers run in your browser.
Start your plan →