A Die With Zero spreadsheet, or a solver?

A spreadsheet can show you the shape of a die-with-zero plan for free. What it can't do well is two things a real plan needs: re-solving the number every time an input changes, and telling you how that number holds up against a bad decade in the market. Here's where a sheet is genuinely fine, where it quietly misleads you, and what the gap costs in real numbers.
What a spreadsheet gets right
Several people have built and shared Die With Zero spreadsheets — a column per year, assets growing at an assumed rate, spending coming out, a running balance. Money Flamingo's write-up walks through building one the same way. These are free, and building one once is a genuinely useful exercise: it forces you to write down your assumptions and watch the balance move.
For getting the shape right — net worth rising then being drawn down, as covered in the method, explained — a spreadsheet is enough. You don't need a solver to see that spending more now means less left at the end.
Where it breaks: the number is a guess dressed as arithmetic
The die-with-zero number — the most you can add to your spending and still land near zero — isn't a formula you fill into a cell. How to calculate your die-with-zero number covers why: change any input and the right answer changes with it, so a spreadsheet either hard-codes one growth rate and nudges the spending cell by hand until the final balance looks like zero, or it doesn't really solve at all.
That's tedious, but it isn't the real problem. The real problem is what "the final balance looks like zero" is actually telling you.
The gap, in real numbers
Take zeroleft's own sample plan — age 35, about £380,000 invested, a £250,000 home, £60,000 of yearly costs — and solve it the way a spreadsheet does: one assumed return per asset, one deterministic path. That solve says you can add £34,275 a year to your spending and still land at zero by 90.
Run that same £34,275-a-year spend through 500 simulated market paths instead of one — the same sequence-of-returns stress test covered on the die-with-zero number page — and the picture changes:
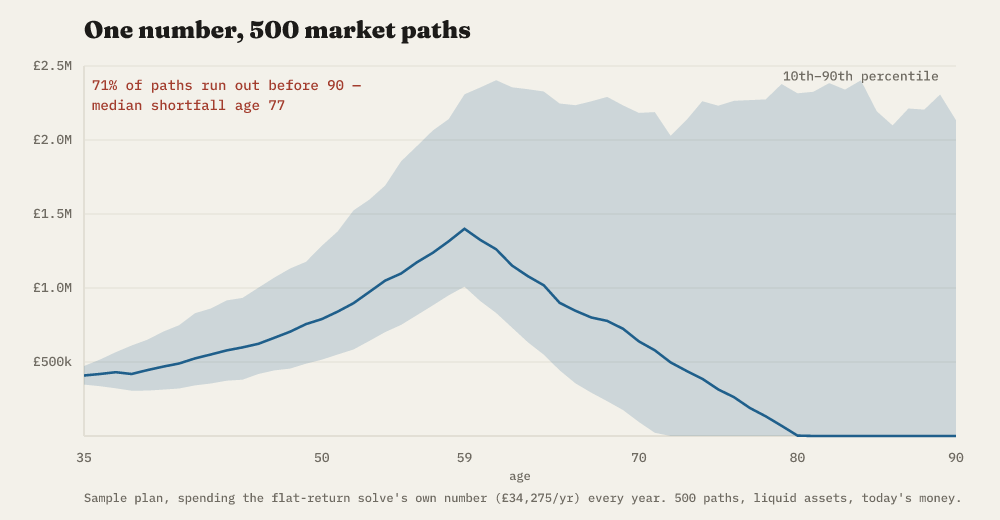
71% of the 500 paths run out of money before 90. The median path that fails runs dry at 77 — more than a decade before the horizon the spreadsheet solved for.
This isn't a bug in the arithmetic. It's what a deterministic solve necessarily does: it searches for the largest spend that survives exactly one assumed path, which puts the answer right at the edge of failure on that path. Real markets don't follow the assumed path — half the time they're worse than average in any given stretch — so a number solved against a single return figure fails most of the time it's tested against real variation. Sequence-of-returns risk is the mechanism: the same average return over 30 years can still ruin you if the bad years land early, while a flat-return sheet can't see the order of returns at all, only the average.
Dialling the spend back to a level the same stress test says has about a 1-in-10 chance of running out — £14,842 a year, roughly 57% less than the spreadsheet's number — is what an honest version of this plan looks like. That's not a small rounding difference; it's the gap between a number that sounds achievable and one you can actually rely on.
What this means for you
- A spreadsheet is fine for exploring the idea. Use one to get comfortable with how a die-with-zero plan moves.
- Don't spend to a number a flat-return sheet gave you. By construction, it's the riskiest number that technically balances — not a safe one.
- Ask what the failure rate is, not just the final balance. "Ends at zero" and "ends at zero on the one path I assumed" are very different claims.
- A smaller, stress-tested number beats a larger, fragile one. The whole point of drawing your account down is confidence, not a number you're secretly worried about.
None of this is a reason to distrust the die-with-zero idea — it's a reason to distrust a single-path arithmetic exercise standing in for a real plan. The survival threshold still holds as a floor either way; what changes is how much you can safely spend above it.
Run it properly, free
zeroleft does both halves of this for free: it solves your die-with-zero number, then runs it through a Monte Carlo stress test across thousands of market paths so you see the failure rate before you commit to a spending level, not after. No spreadsheet required, no login for a rough first number.
It's a planning aid, not financial advice, and it has no tax model — enter returns net of fees and tax. Every assumption is on the methodology page.
Common questions
Is there a free Die With Zero spreadsheet?
Yes — several people have published Google Sheets versions online. They're a reasonable way to see the shape of a die-with-zero plan for free. Where they fall short is re-solving as your numbers change and stress-testing the result against bad markets.
Why does a spreadsheet's die-with-zero number look too good to be true?
Because it usually is. A sheet built on one assumed rate of return finds the largest spend that survives exactly that one path — which puts it right at the edge of failure. Add any real market variation and a large share of outcomes run out early.
Solve your number, then stress-test it, free
Start your plan →